Published:
Tagged: Rails Monitoring Self-Hosting Open-Source Home-Lab
Veglia - a monitor that records its own downtime
TLDR; a monitor running on the machine it monitors writes nothing while it’s down, and most dashboards read that silence as health. Veglia records the minutes it didn’t observe, classifies them using the kernel’s boot time, and never prints uptime without coverage next to it. Rails 8.1, SQLite, MIT.
There’s a Mac Mini in my home office running several Claude Code sessions with remote control turned on, so I can hand them work or ask questions from my phone while I am out. One afternoon it stopped answering.
“Nothing” isn’t one failure. The Mini could have rebooted, the house could have lost its connection, or the tunnel could have dropped with both ends healthy. Those need different responses, the only thing that could have separated them was on the far side of whatever had broken, and the monitor I already had reported that afternoon as 100% up.
The failure it’s built around
A monitor running on the machine it monitors, can’t observe its own downtime. When the machine reboots or the app dies, no row is written, so an empty stretch that means nobody was looking gets counted as nothing was wrong.
Observing and recording are different problems though, and only the first is impossible. The minutes are gone; the shape of the hole they left isn’t.
Absence as evidence
Veglia is Italian for a vigil kept through the night. It writes one row a minute, with every row carrying the kernel’s boot time. Each check begins by measuring the distance to the previous one, so a hole is something it notices. When it finds one longer than about ninety seconds, the boot time on either side classifies it:
| Boot time across the hole | Reading |
|---|---|
| changed | the machine rebooted, so the downtime is the machine’s |
| unchanged | the machine was fine, and Veglia was the thing missing |
Both become recorded outages with a start, an end and a reason, sitting alongside the observed ones. The distinction matters when you come to fix something: one says buy a UPS, the other says your daemon isn’t staying up.
Hence the reporting rule the rest of the design serves. Uptime is never shown without coverage beside it.
99.4% up across 98.1% coverage
Uptime is of the minutes actually observed; coverage is how many of the window’s minutes those were. The two move independently, so a bad week and a blind week are indistinguishable until you separate them.
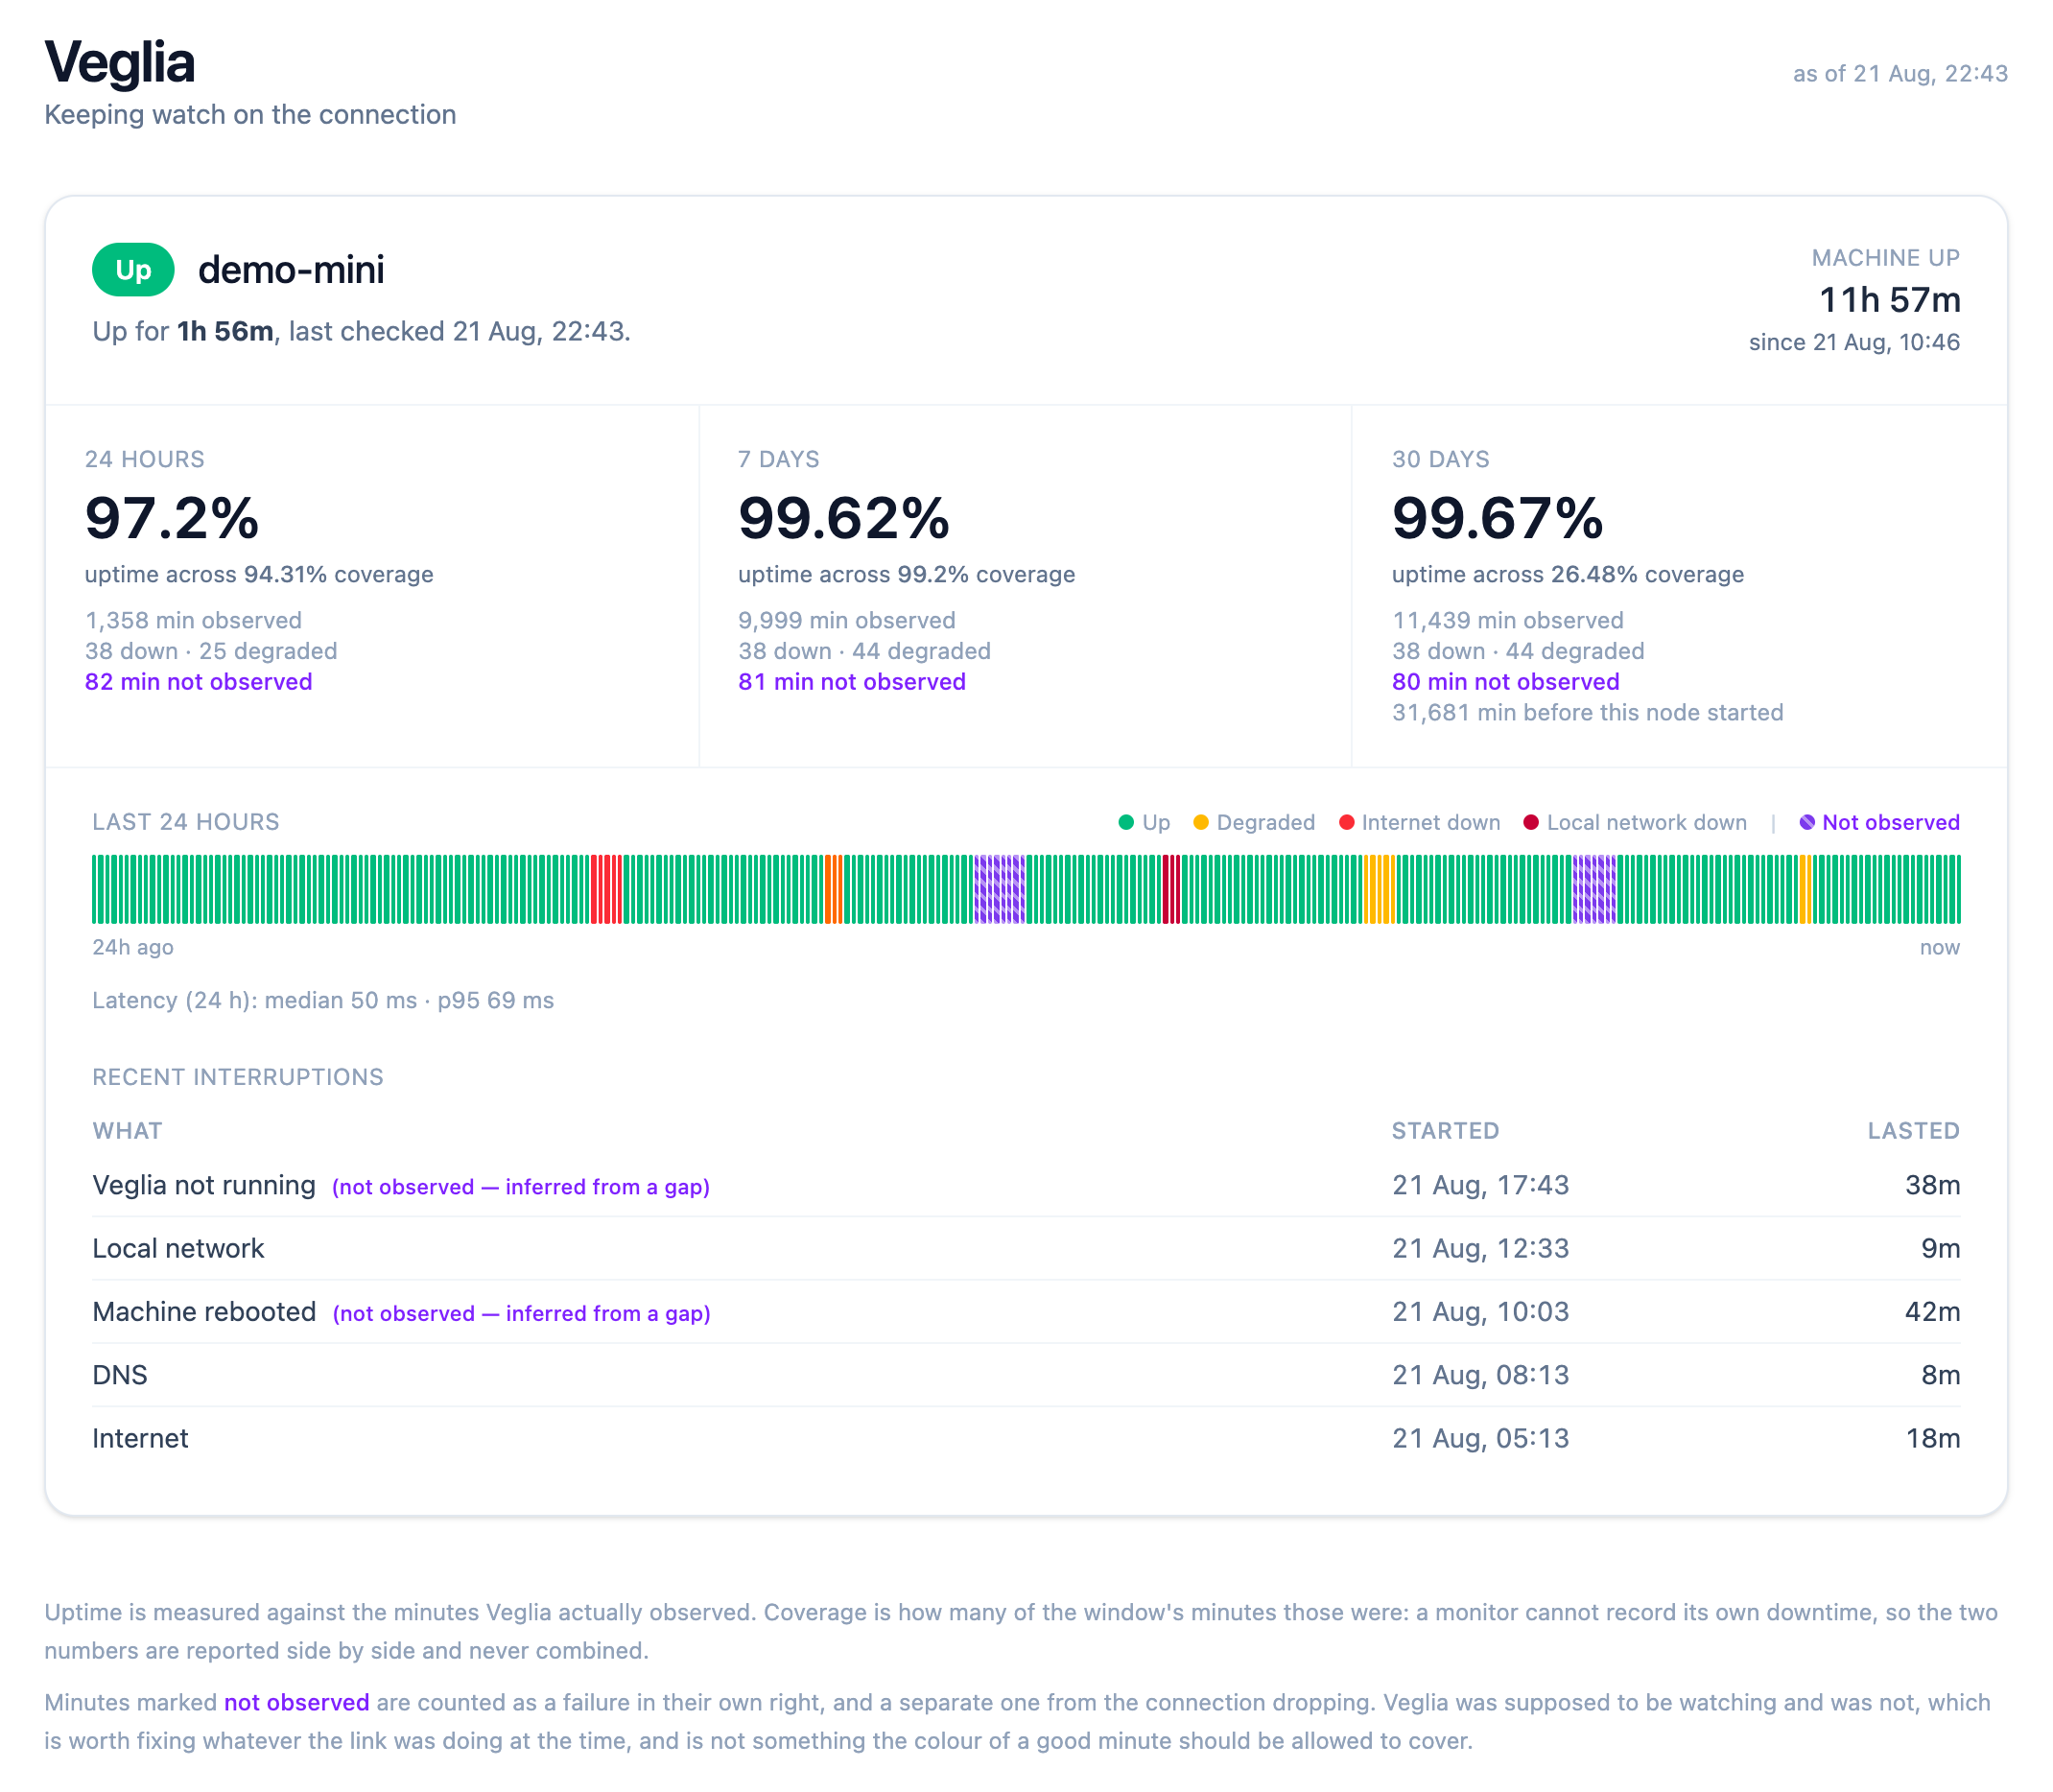
Minutes it didn’t observe get their own colour, the hatched purple. They’re neither good nor bad, and folding them into either bucket is the original bug.
Three tiers, so a red light names a remedy
Each check runs three probes concurrently, taking about fifty milliseconds:
- one ICMP packet to the default gateway,
- a timed DNS lookup,
- three independent 204 endpoints, at a quorum of two.
Three endpoints rather than one, so a provider’s own outage is never recorded as yours.
The ordering matters, and it’s the one piece of hard-won logic in the codebase: working internet is checked before the gateway. Plenty of consumer routers decline to answer ICMP, so reading the gateway first reports a permanent local failure on exactly those networks while the internet demonstrably works. The quorum is consulted first, and the lower tiers are only asked where it broke once nothing has answered.
There’s a fourth state. If everything answers but the HTTP round trip is slow, the check is degraded, which counts as connected: the link existed, and calling it downtime would overstate the problem.
What it’s made of
Rails 8.1, SQLite and Tailwind, with the probing on the Ruby standard library alone. No monitoring gems and no external services: an application whose whole product is an honest record should have as few dependencies as possible that can break quietly.
It runs as a single launchd job, with Solid Queue’s recurring tasks driving the cadence inside Puma, so there’s no web process and worker pair that can drift apart. It’s a LaunchDaemon rather than a LaunchAgent, because an agent starts at login and a headless Mini rebooting at four in the morning may sit for days with nobody logged in.
Two caveats worth having up front:
- FileVault defeats part of that reasoning. Nothing starts until the disk is unlocked at the pre-boot screen, so an unattended reboot still costs the minutes until somebody types a password. Veglia records those correctly as an app gap, which is how I found out.
fdesetup authrestartcovers planned reboots and nothing covers a power cut. - Retention is ninety days of per-minute rows, with each completed day rolled into a summary row before the prune runs. Getting that order wrong destroys the history the rollup exists to keep.
The screenshot is generated
My connection has been fine, so the DNS failure, ISP outage and dead router above have not happened here. They come from bin/rails demo:seed, which ships with the repo, generates eight days covering every state, and refuses to run in production. Staging a screenshot would have been quicker, and a picture of failures that never happened is the move this application spends its whole design avoiding.
Try it
git clone https://github.com/pardel/veglia
cd veglia && bin/setup
bin/rails demo:seed    # optional: fill it with a week that went wrong
bin/dev                # http://localhost:3000
Read the install script before running it, and keep it on your own LAN. MIT licensed, at github.com/pardel/veglia.
Every number on that dashboard names how much of the window it’s speaking for. A tool that tells you what it doesn’t know is worth more than a confident one, because the confident one has no way of being wrong in front of you.